|
Edited by Park, Younshik |
|
1. Development of Input Interface of Web GIS based VFSMOD System The Web GIS based VFSMOD system was developed by Kyoung Jae Lim and Younshik Park (June, 2008) to simulate VFS performance and calculate sediment reduction effect of the VFS. Two versions of the Web GIS based VFSMOD systems were developed; one is the 'Single Storm Event Analysis' version and the other is the 'Multiple Storm Events Analysis' version (Figure 1). The 'Multiple Storm Events Analysis' version runs 'Single Storm Event Analysis' version for up to 45 times in batch mode. The Web GIS based VFSMOD system is comprised of a client-side interface, server-side pre and post-processors, and UH and VFSM engine (Figure 2). 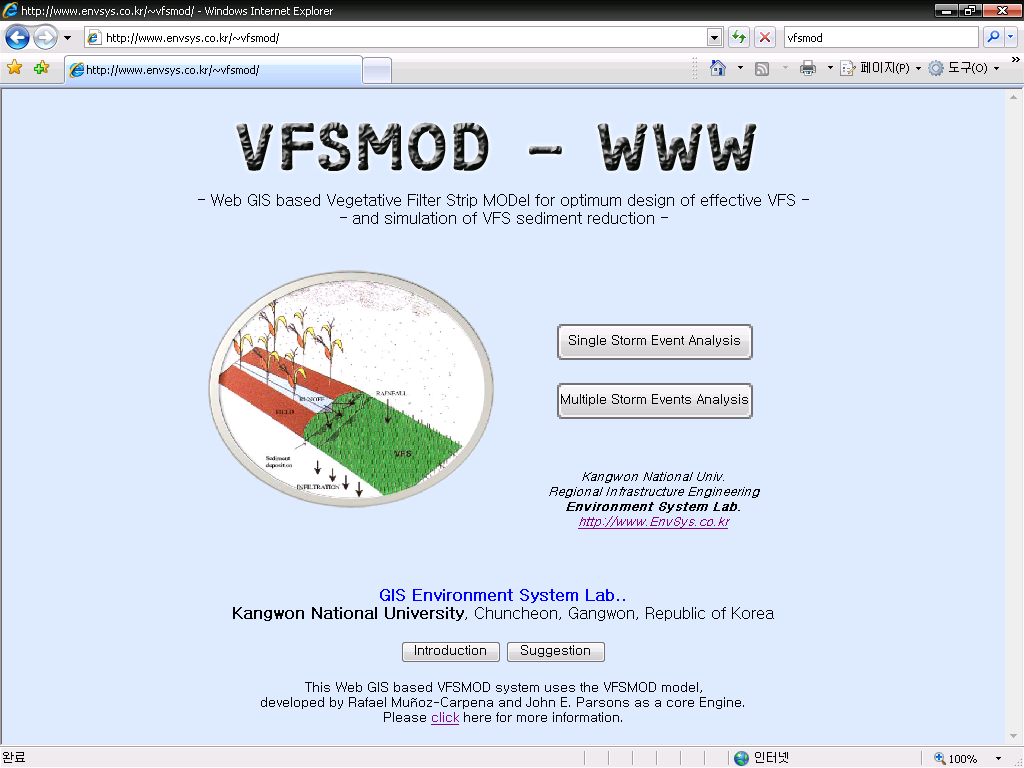 Figure 1. Single Storm Event and Multiple Storm Events Analysis Options in the Web GIS based VFSMOD System (http://www.EnvSys.co.kr/~vfsmod) 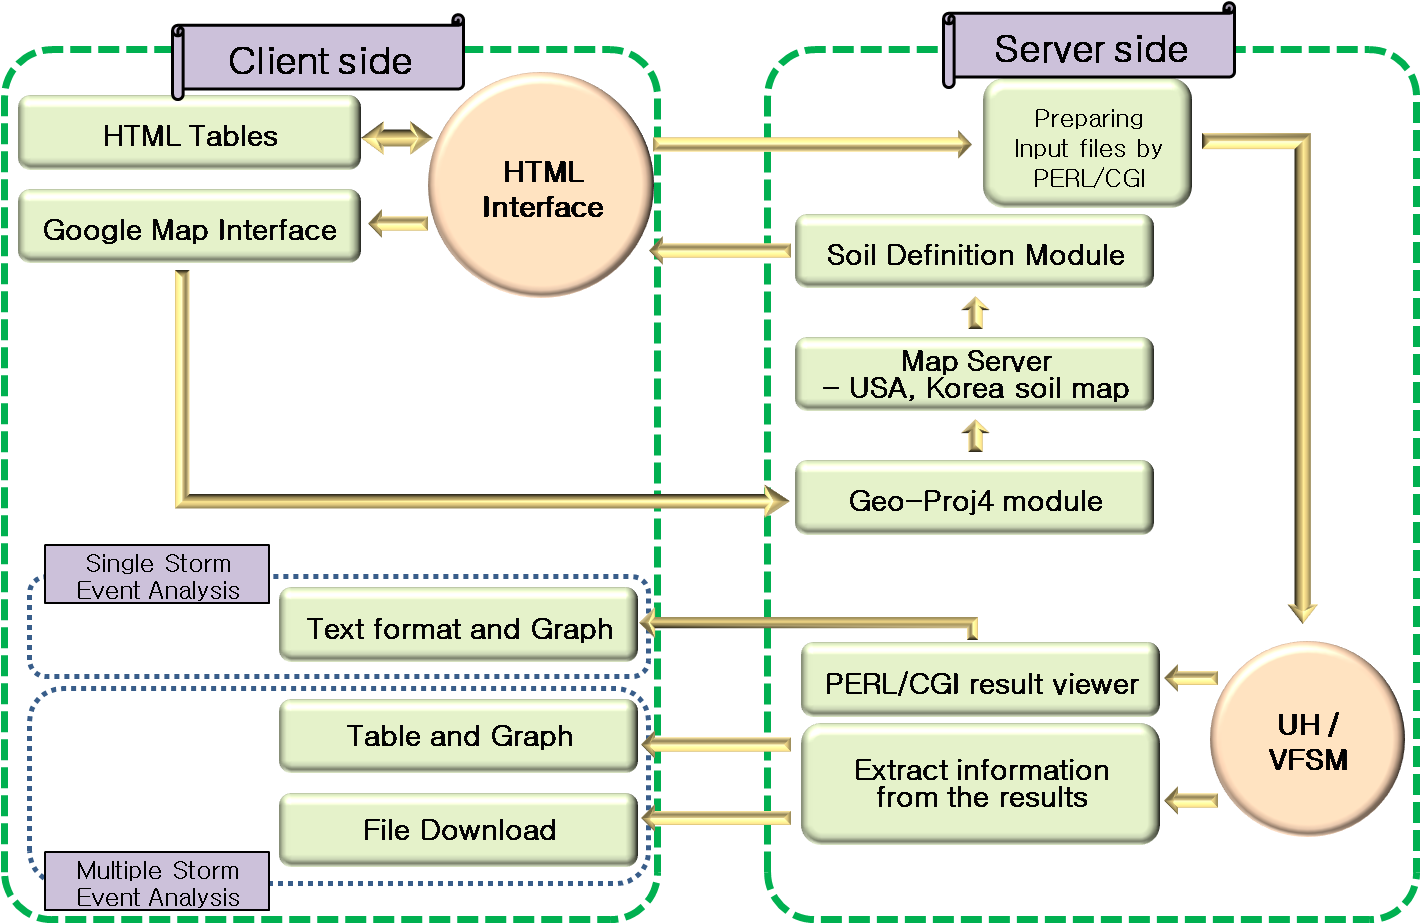 Figure 2. Overview of Web GIS based VFSMOD. The client-side was developed with the languages of HTML, DHTML, Perl/CGI, Java script, Google Map API, and Map Sever Web GIS application. The input interface is comprised of ¡°Rainfall Event and Runoff¡±, ¡°Source Area¡±, ¡°Erosion Parameter¡±, ¡° Rainfall Factor¡±, ¡°Buffer Dimension¡±, ¡°Green-Ampt Infiltration Parameter¡±, and ¡°Vegetation Parameter¡± section (Figure 3). The input menu has been rearranged, and the range of each input data and available/recommended values are provided as a table for users to understand and choose proper input values. Also the superfluous repetition of data input has been reduced. Thus, with limited input data, users can run the VFSMOD system and analyze the output for site-specific design of filter strip with several clicks of the mouse button, which were not possible with the desktop-based VFSMOD (Figure 3). 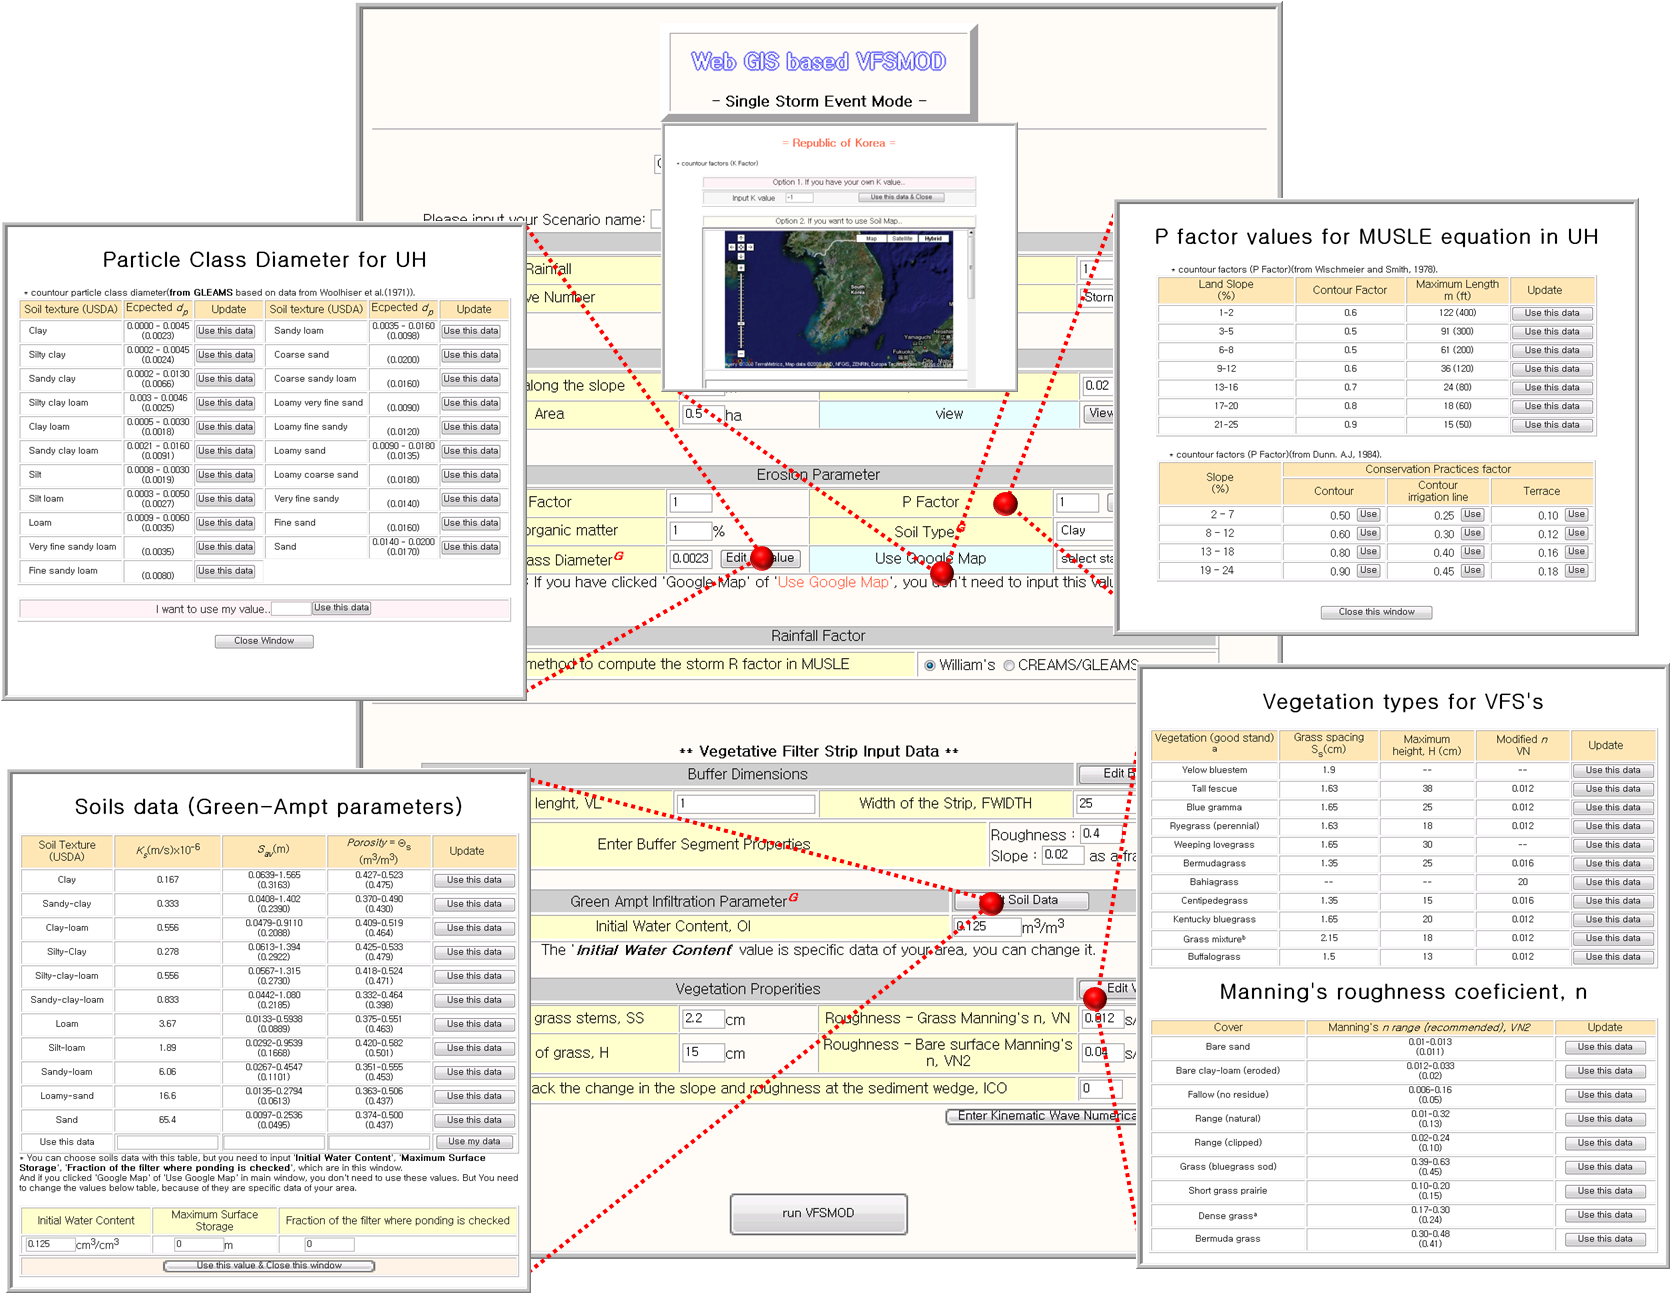 Figure 3. Interface of Web GIS based VFSMOD (Single Storm Event mode) In the input process of ¡®Source Area¡¯, the input data ¡®soil type¡¯, ¡®class diameter¡¯, and ¡®practice factor¡¯ in the ¡®Erosion parameters¡¯ option are given in a HTML table or through a Google Map interface to a Map Server soil database. However, ¡®Rainfall event and Runoff¡¯ and ¡®Source Area¡¯ options are left to the users because these are specific to each simulation. The input data ¡®soil type¡¯ is defined by relative ratio of silt, sand, and clay composition which are stored in the Web GIS VFSMOD sever. The input data ¡®Particle class diameter¡¯ (Table 1) is determined with ¡®soil type¡¯, thus can be determined with the Google Map interface to the Map Server soil database system. The recommended input data ¡®practice factor¡¯ (Wischmeier and Smith, 1978) is provided in HTML tabular format (Table 2). 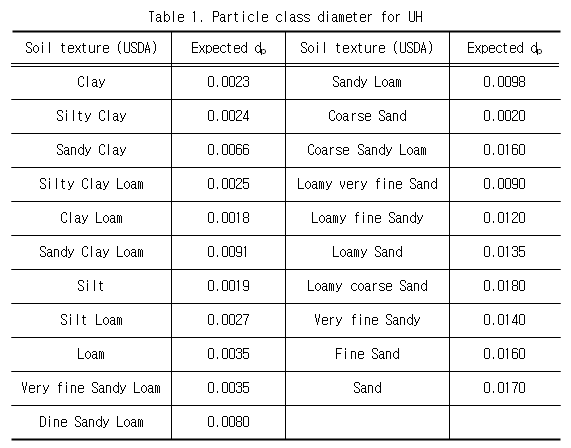 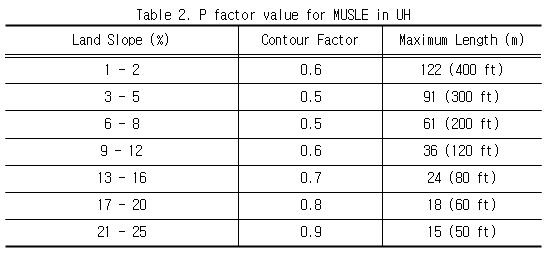 Also, in the process of ¡®Filter Strip¡¯, the input ¡®buffer length¡¯, and ¡®width of the strip¡¯ of ¡®overland flow inputs¡¯ option are left to the users because these information are site-specific in each simulation of study. However, recommended values of ¡®Soil Properties¡¯ and ¡®Buffer Vegetation Properties¡¯ are given in an HTML table, or queried using the Google Map interface to the Mapserver soil database. First, the input data ¡®vertical saturated K¡¯ and ¡®saturated water content¡¯ (Green-Ampt parameter; Rawls and Brakensiek, 1983) of ¡®Soil Properties¡¯ (Table 3) by ¡®soil type¡¯ can be determined with the Google Map interface. Second, the recommended input data ¡®spacing for grass stems¡¯, ¡®height of grass¡¯, and ¡®roughness¡¯ of ¡®Buffer Vegetative Properties¡¯ are provided in tabular format (Haan, 1994) (Tables 4, 5) to help model users select appropriate values. 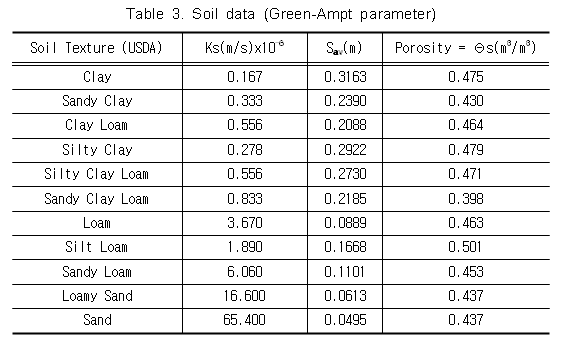 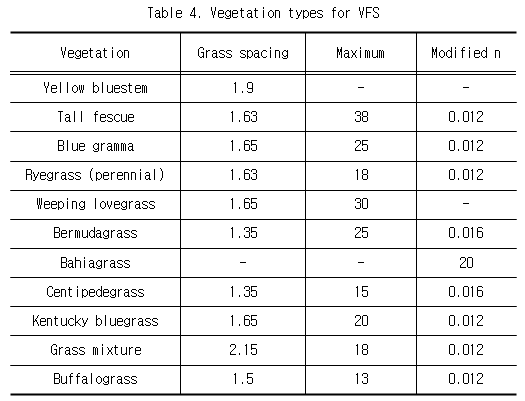 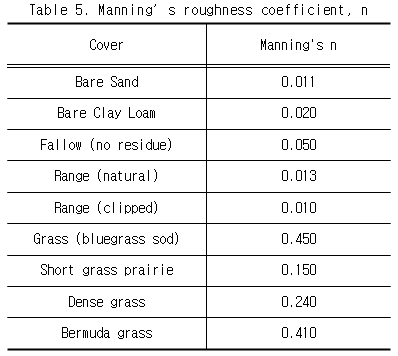 2. Development of On-the-fly Google Map Interface to Mapserver Soil Database Although the Web GIS based interface helps model users run the VFSMOD with less input data, compared with the desktop version of the VFSMOD, the users need to prepare soil property of the area of interest, which is sometimes time-consuming and hard to find for novice users. Thus, the Google Map interface was developed to query soil properties of the point of interest through server-side Mapserver application. The soil maps for South Korea and Alabama (AL), Indiana (IN), Illinois (IL), Kentucky (KY), Michigan (MI), Mississippi (MS), Tennessee (TN), and Wisconsin (WI) STATSGO soil database is stored at server-side for automatic soil property extraction from the Google Map interface. The work is underway to extend this to 48 states for practical application of VFSMOD system in the continental USA. The Google Map interface to Map Server soil database was developed to help users find and choose the study area easily and comfortably. Because the Google Map uses ¡®coordinate of Latitude and Longitude; Lat/Lng¡¯ and the soil map uses ¡®coordinate of Transverse Mercator (TM)¡¯ for South Korea or with ¡®coordinate of Universal Transverse Mercator (UTM)¡¯ for Alabama (AL), Indiana (IN), Illinois (IL), Kentucky (KY), Michigan (MI), Mississippi (MS), Tennessee (TN), Wisconsin (WI). Thus Geo-Proj4 module (http://search.cpan.org/dist/Geo-Proj4/) was used for on-the-fly projection for automatic soil property query from Lat/Long-based Google Map interface to TM/UTM soil data stored in Mapserver application. Also another sub-module was developed, named ¡®Soil Type Definition¡¯ using Perl/CGI, to define soil type by the ratio of silt, sand, and clay composition. This module classifies soil types as Sand, Sandy loam, Loam, Silt Loam, Clay loam, Silty clay loam, Sandy clay, Silty clay, Clay. These modules were integrated with the Web GIS based VFSMOD model as a sub-module. The Korean soil database contains the ratio of silt, sand, and clay of the point of interest. Thus, the ¡®Soil Type Definition¡¯ module determines the soil type name for the VFSMOD system on-the-fly. However, the STATSGO soil database for AL, IN, IL, KY, MI, MS, TN, WI contains MUID, not the soil composition ratio. Thus, CGI programs were written to query soil database stored at Purdue University ECN server from the VFSMOD Mapserver domain and retrieves soil information for ¡®Soil Type Definition¡¯ module. To implement this capability, the CGI program was written and stored at the Purdue ECN server to process the query from the VFSMOD web server. It takes less than a second for this process. The soil type, particle class diameter, vertical saturated K, average suction head at the wetting front, saturated water content information are provided to the users with this Google Map interface to the Mapserver soil database. With this Google Map-based Web GIS interface, the complex soil input data are prepared within a second on-the-fly (Figure 4). 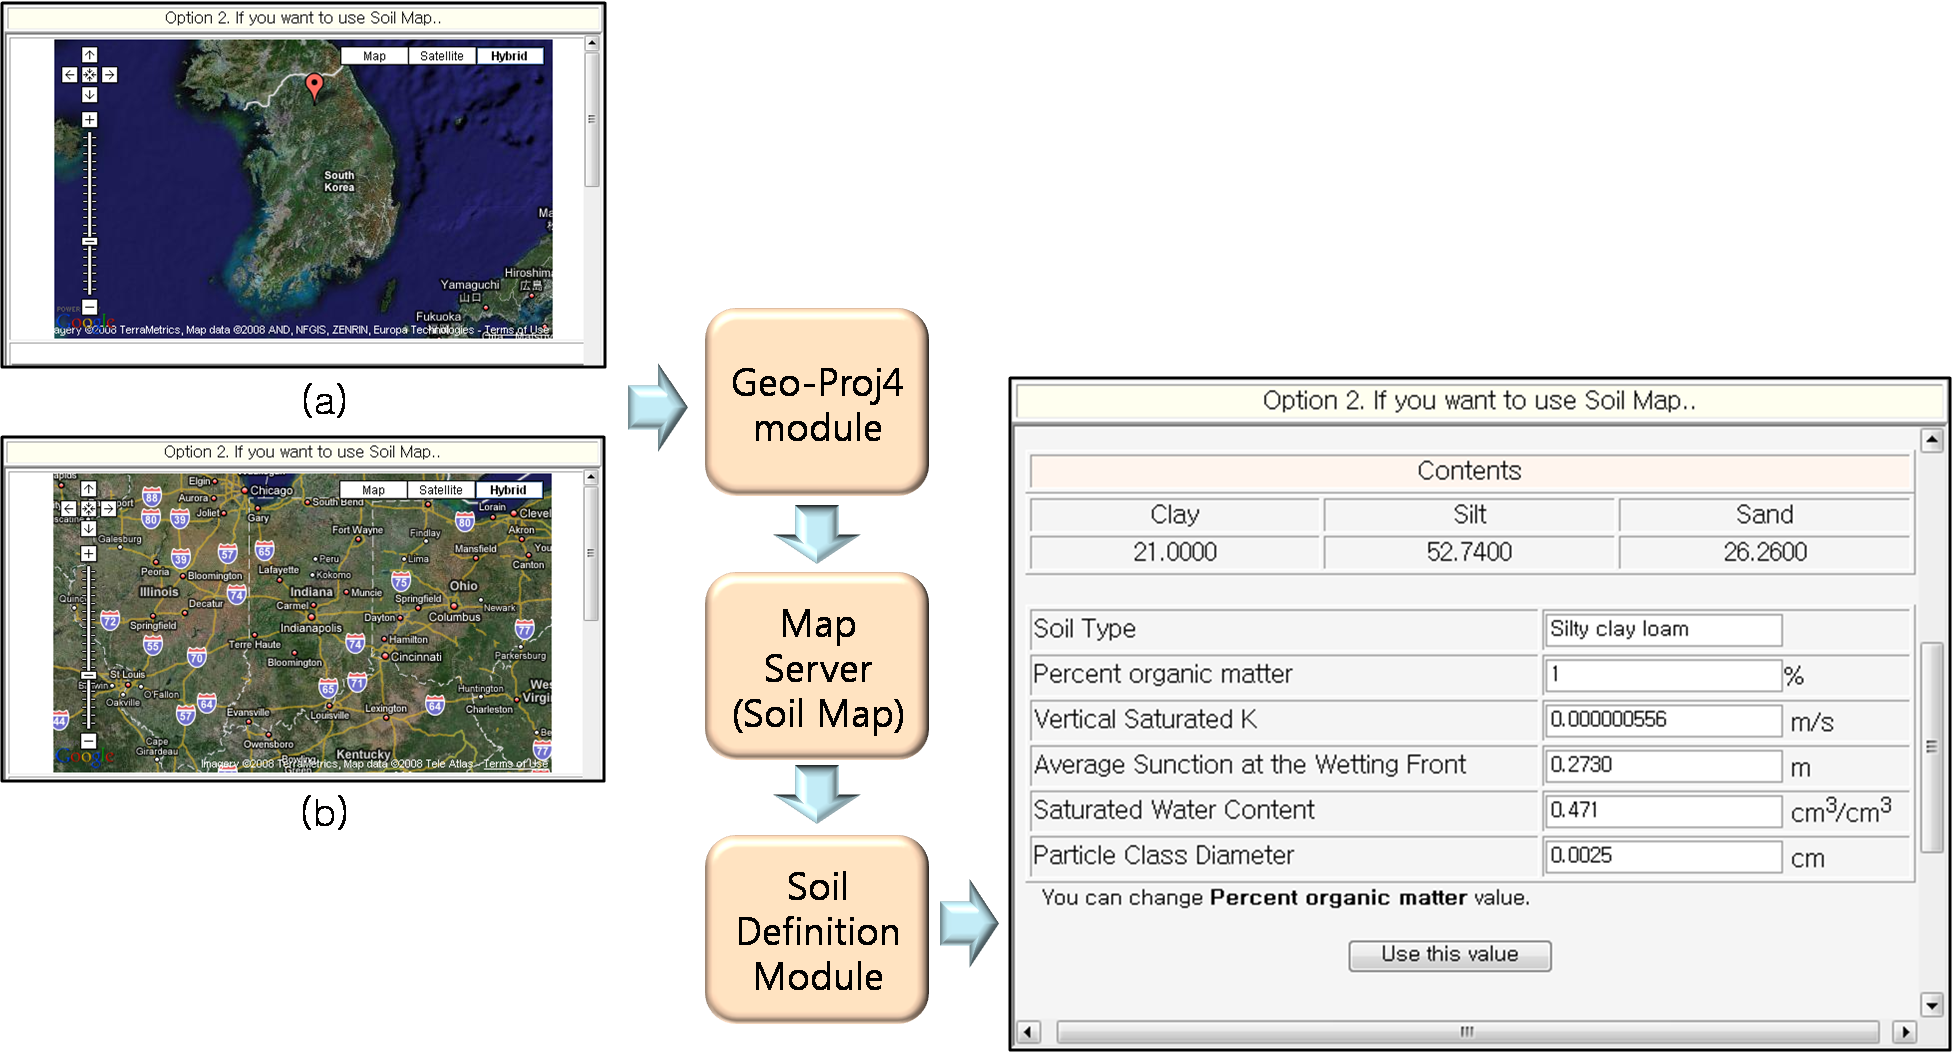 Figure 4. Google Map Interface for using many input data 3. Multiple Storm Events Analysis Options The desktop based VFSMOD-w can be run only once for each input data. The effect of the VFS on reduction of sediment or flow can be simulated under only one condition of rainfall and VFS width (Single Storm Event Analysis option, as shown in Figure 6). Because of this limitation in the desktop-based VFSMOD system, the model users have to run the desktop-based system dozens of times to determine effective VFS width under various rainfall conditions in the field. The Single Storm Event Analysis option uses various files, described earlier, such as INP, IKW, ISO, IGR, ISD, IRN, and IRO files. The INP and IKW files contain the rainfall and VFS width value, respectively. Thus, a number of INP and IKW files are needed to simulate various filter strip scenarios in the field. In this study ¡®Multiple Storm Events Analysis¡¯ option was developed to automate the single storm analysis for up to 45 times with 5 INP files and 9 IKW files. Most of the functions are similar with Single Storm Event mode, but maximum 5 design storm values and maximum 9 VFS width values can be simulated. The ¡®Multiple Storm Events Analysis¡¯ mode in the Web GIS based VFSMOD generates the INP and IKW files with user-provided rainfall and VFS width values, The Multiple Storm Events Analysis¡¯ mode uses these INP and IKW files with other ISO, IGR, ISD, IRN, and IRO files to determine optimum filter width under given conditions (Figure 5). The Google Map interface to the Mapserver soil database is also provided in the Multiple Storm Events interface. 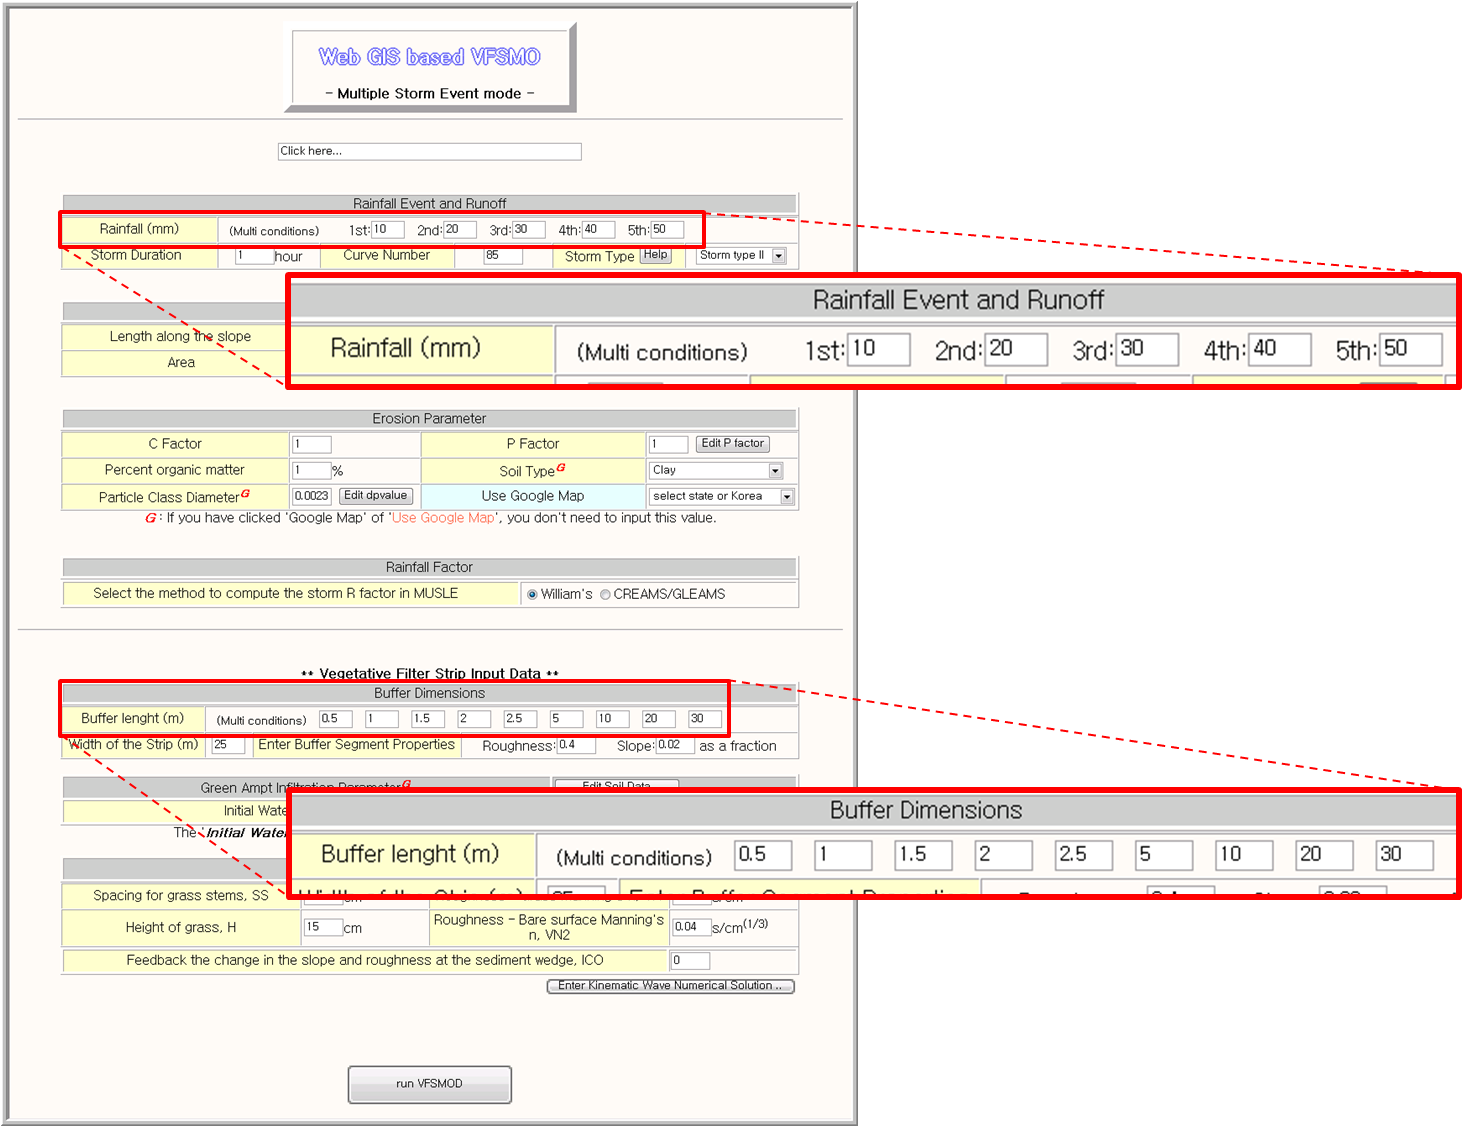 Figure 5. Multiple Storm Events Analysis in the Web GIS based VFSMOD System 4. Development of Output Interface of Web GIS based VFSMOD System Once the model is run, the post processors at the server-side compile the model output and generate tabular and graphical output for easy understanding of the simulation. For the Single Storm Event option, the graphs of hyetograph, hydrograph, sediment are generated using Java applet and Perl/CGI programming (Figure 6(a)). Also, other output files from the UH and VFSM are provided in textural format for further analysis if needed. With the output interface, the Web GIS based VFSMOD users can easily find the effects of different scale of the VFS on its performance under the user specified condition quickly. For Multiple Storm Events mode, the post processors rearrange the output files to compile output information for VFS width design. The trapping efficiencies under various VFS width and design storm events are provided in tabular format. The output can be downloaded into a desktop spreadsheet program for further analysis and reporting purpose. The trapping efficiencies are provided in graphical format also with the cross-hair interface for quick identification of optimum VFS width or trapping efficiency under a certain condition (Figure 6(b)). 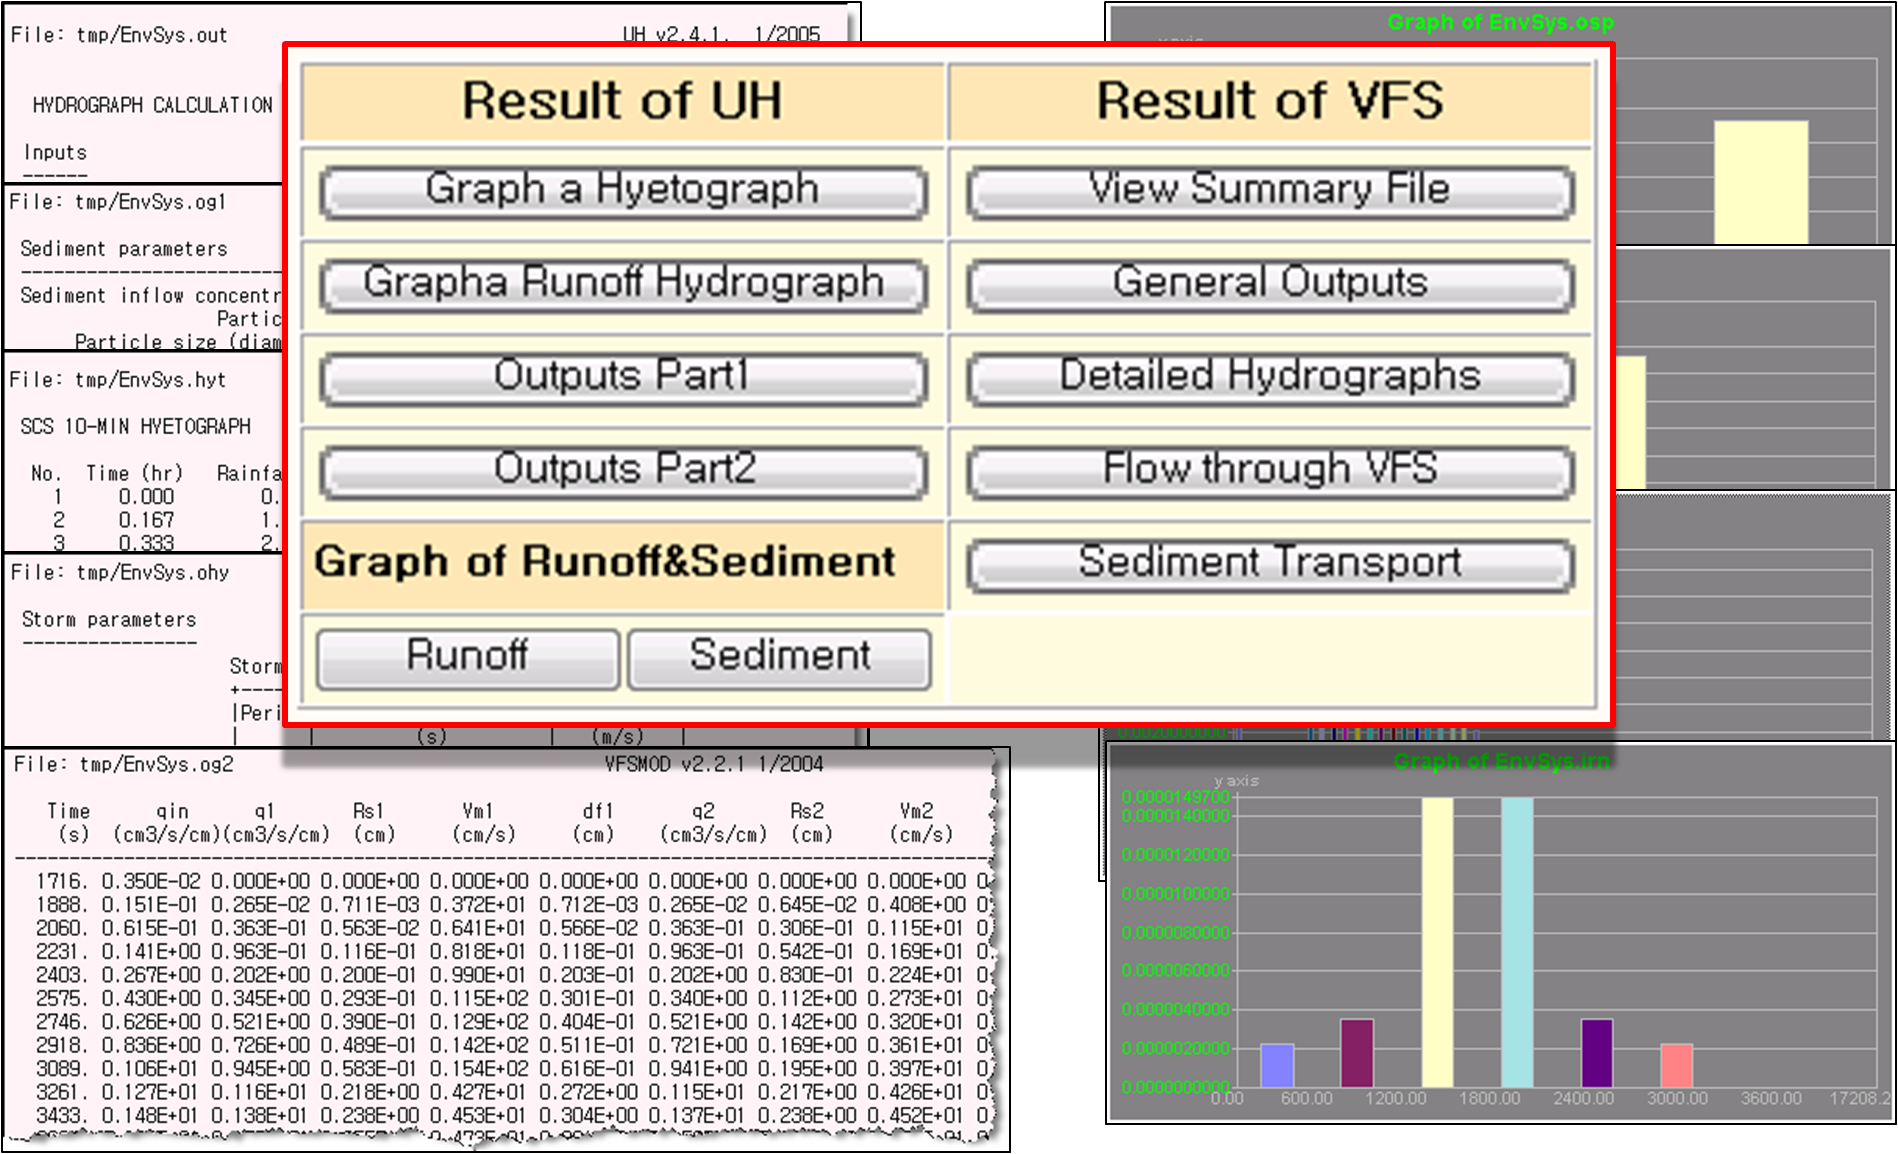 (a) 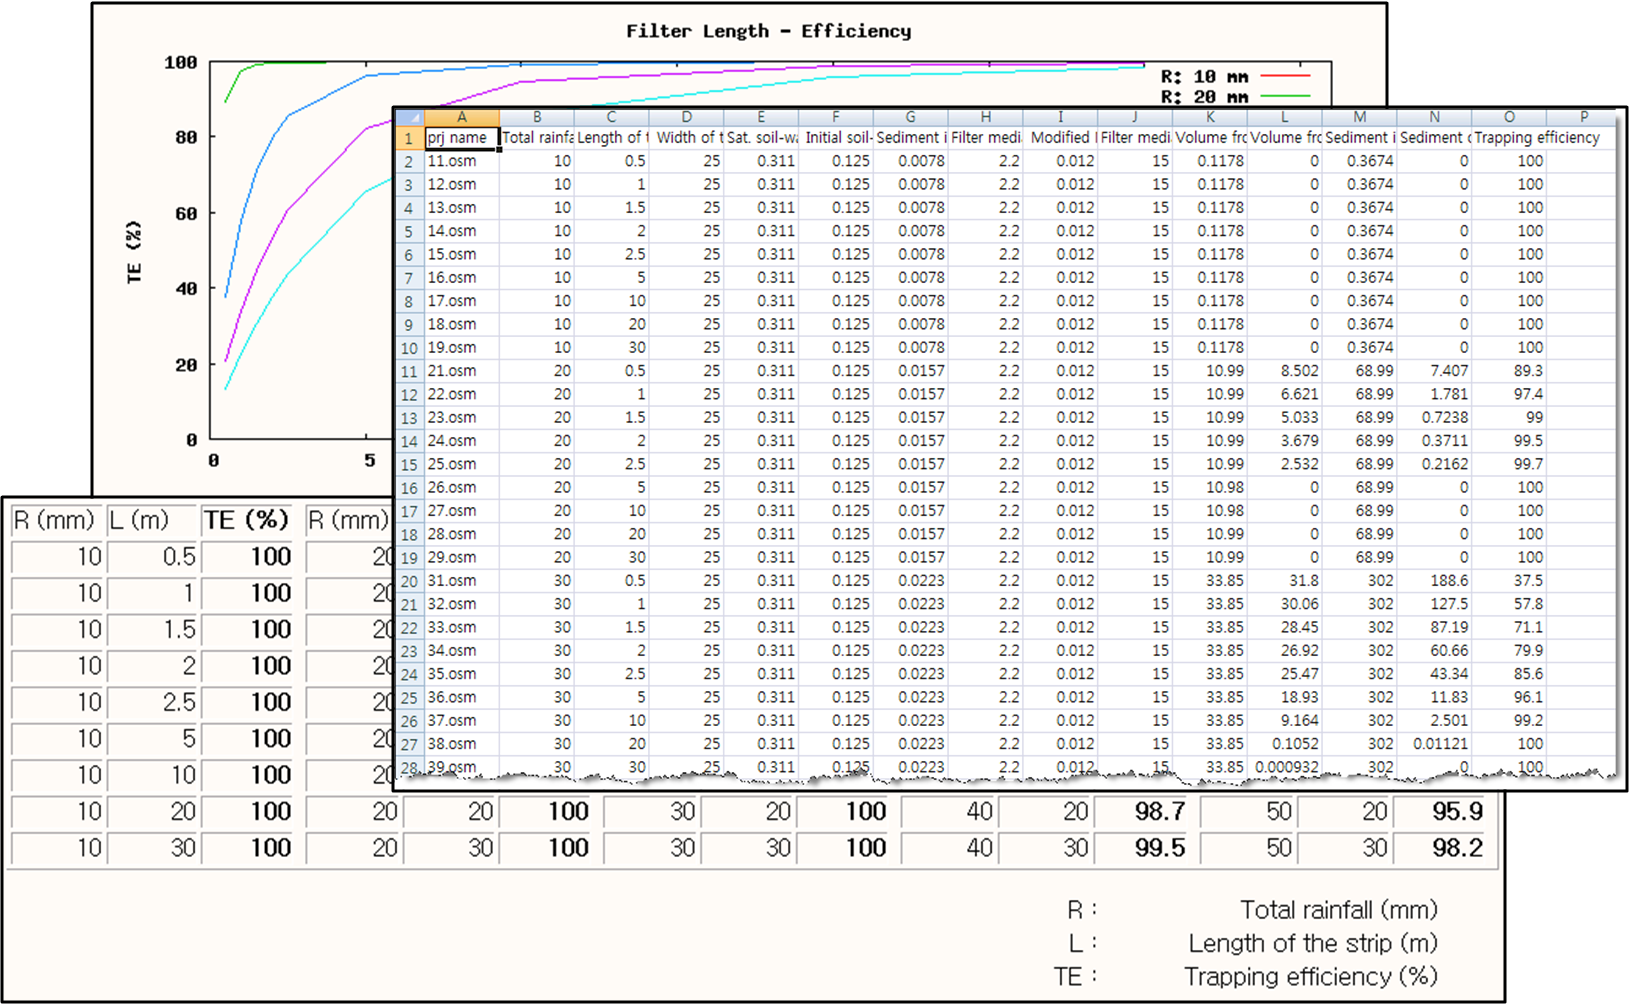 (b) Figure 6. Tabular and Graphical Output of Web GIS based VFSMOD System |
|
|